
Another week and another hypothetical situation! This picks up where we left off last week. If you missed the last exploration, please consider taking a few moments to learn about managing dynamic requirements in your embedded system by reading this post first.
Recapping, you are an engineer working on developing some novel new technology. You are managing your project’s dynamic requirements by taking advantage of the selection of a System-on-Chip (SoC) with a heterogeneous system architecture. That is, an architecture with both programmable logic (PL) and processing system (PS) components that work together to process your algorithms. To meet the performance requirements you are optimizing the performance of your system by offloading portions of your software algorithm to the programmable logic. Thanks to a tool like Xilinx’s SDSoC Development Environment (part of Xilinx’s SDx toolchain), transferring your C model algorithm to the PL is straightforward.
You have familiarized yourself with the options for transferring data in and out of your FPGA, and you have selected a block of your algorithm and a corresponding data mover within the tool that looks to be the best choice for your design. The software estimation tool, provided in the SDSoC Development Environment, shows promising expected performance results from offloading your selected functionality.
Everything is set up for success.
When performing the ultimate test of execution on real silicon, the performance of your system is not matching up to expectations. Something is not quite right – executing your system test bed on the target with your offloaded software running in PL is resulting in different performance from your estimation. Because of offloading software to the PL, your existing software debugging/analysis methods do not apply, as not all of the processing is occurring in the PS. In order to move forward with development, you need to learn what is causing the unexpected performance slowdown. Is it a sub-optimal choice of data mover? Alternatively, was the offloaded code ultimately not as good of an offload candidate as originally believed?
You cannot fix it without knowing the cause of the issue. How do you investigate and debug system performance on a heterogeneous embedded system?
For an engineer familiar with model based algorithm development and newly exploring the world of debugging PL data processing, you may not know immediately what options you have to view the PL data flow. Fortunately, if the toolchain used to offload the software into the PL for acceleration was the Xilinx SDSoC Development Environment, there is a solution. SDSoC has an emulation capability for viewing a simulated operation of your PL hardware platform, as it operates within the context of your overall system. It is possible to view the hardware signals’ waveforms by leveraging the same simulation functionality available to PL engineers accustomed to developing with the Xilinx Vivado toolset.
This emulation capability allows you to identify if there are any timing issues with the data flow into or out of your auto-generated IP blocks, which perform your offloaded software acceleration, or if there is a slowdown in the offloaded software acceleration itself.
Using this tool may allow you to determine where a bottleneck may be slowing down your expected results. You can investigate these potential bottleneck points by watching the data flow through the hardware via the displayed emulation signal waveforms. It is also possible to investigate the interface points by watching the data signals transfer the data to and from the PL. This information will provide key insight that will enable you to fix your software slowdown by knowing where you should start adjusting your software offload configuration.
To demonstrate a general overview of how to debug/emulate a hardware accelerated function, let us focus on the multiplier IP from the Xilinx MMADD example from Xilinx SDx toolchain. For simplicity, we will focus on one IP block, the matrix multiplier IP block from the Multiply and Add example included with SDSoC, shown in Figure 1.
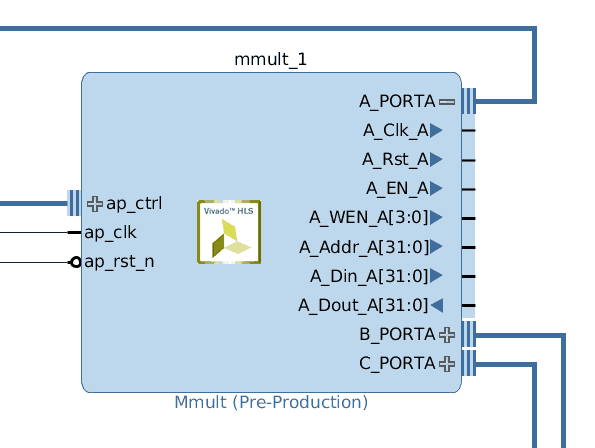
We will look at the waveforms for the signals for this IP block, Mmult, in the emulation. Specifically we will view the A_PORTA signals as shown. They represent the data input for matrix A corresponding to the software input param A to the matrix multiplier function.
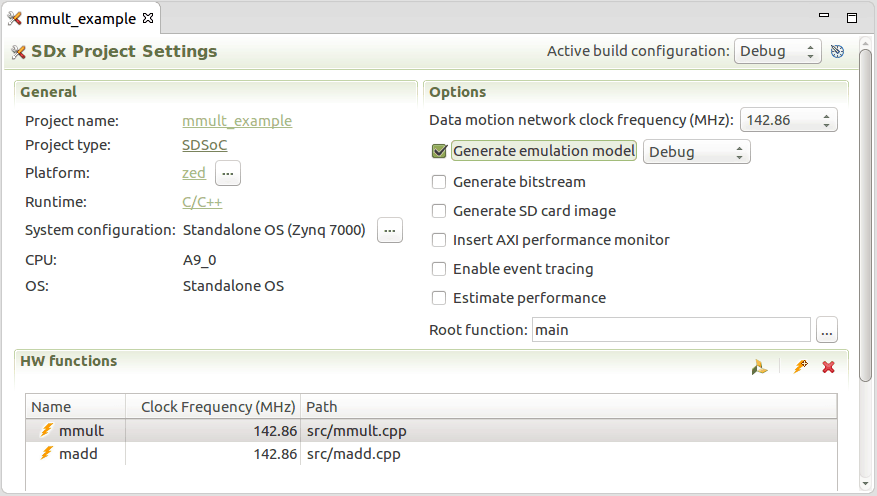
To get started with the emulation, you need to enable generation of ‘emulation model’ configuration for the build in the SDSoC environment’s project’s settings, shown in Figure 2.
Then, rebuild your project as normal. After building with the emulation model support enabled in the configuration you can run the emulator here through the “Xilinx Tools” menu option and selecting “Start/Stop Emulation.” When a window opens, select “Start” to start the emulator. SDSoC will then automatically launch an instance of Xilinx Vivado, which triggersthe auto generated PL project that SDSoC created for you as a subproject within your SDSoC project.
This is where the emulation occurs.
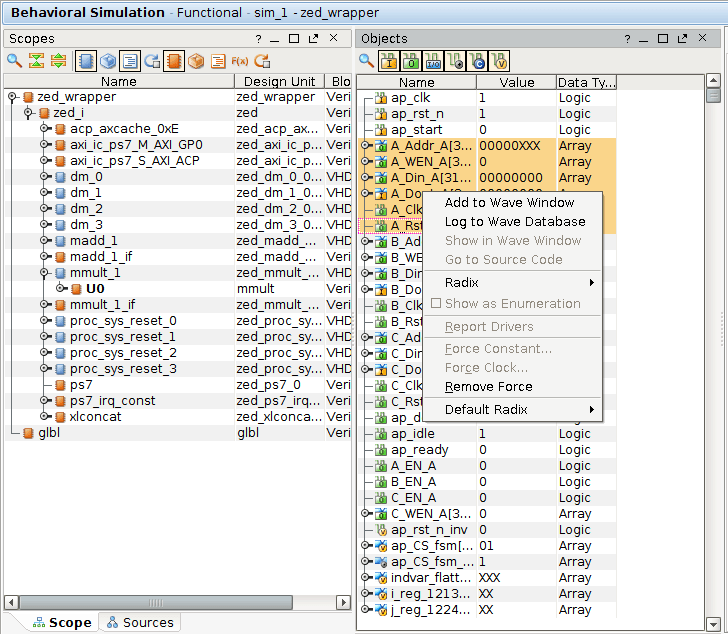
Remember, we wanted to view the A_PORTA signals of the Mmult IP block to investigate the data path into the A_PORTA signals. Signals must be added to the Wave Window to be viewed during a simulation. The available signals of the Mmult IP can be viewed in the Objects pane by selecting the mmult_1 block in the Scopes pane. To add the A_PORTA signals to the Wave Window, select all of the A_* signals in the Objects pane, right click, and select ‘Add to Wave Window’ as shown in Figure 3.
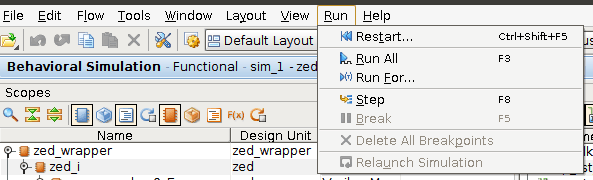
Now you’re all set to run the emulation and view the state of the signals in the waveform viewer. Start the emulator by clicking Run All as shown in Figure 4.
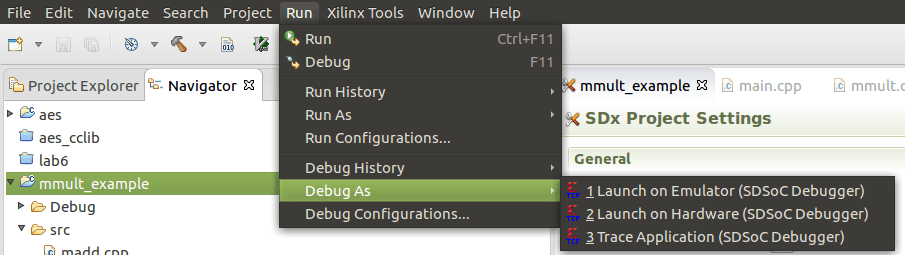
Back in the SDx toolchain’s environment you can now run a debugging session that will connect to this emulation session in the same way that it would connect to your software running on the target. From the “Run” Menu option select “Debug As -> 1 Launch on Emulator (SDSoC Debugger)”, to start the debug session. Now you can step or run through your application test code and view the signals highlighted in the emulator.
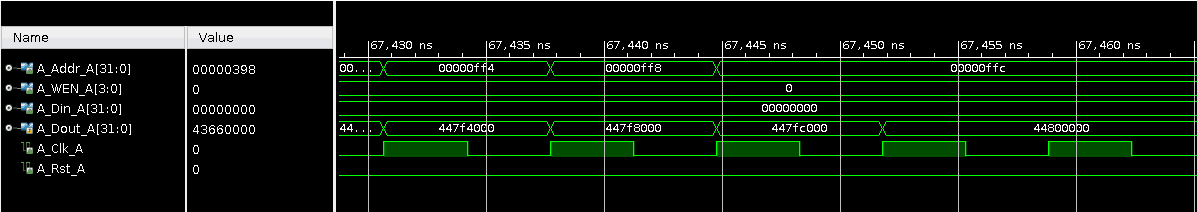
Shown below in Figure 6 are the A_PORTA signals we highlighted earlier and their signal values at the end of the PL logic operation using the Mmult and Add example test code.
If you find yourself in this “hypothetical situation” and you are using the Xilinx development ecosystem, use its provided emulation capability! It is a powerful debugging tool that can help illuminate unexpected behavior in your hardware accelerated C algorithm. It does this by allowing you to peer into the black box of PL processing, and discover any data flow areas that could use some fine-tuning.